For the past 10 years I have got into the habit of doing a financial review at the beginning of January. The goal of this review each year is to look back on the prior year to see what we accomplished, where our money went, and map out a game plan for next year. I believe that conducting an annual financial review like this is critical to staying on track and achieving your financial goals. Here is a summary of what I do and the steps to replicate it.
Step 1: Using Mint to categorize your transactions
In order to execute this financial review, you need to be tracking your financial transactions throughout the year. I have been using Mint for more than 10 years and it is a great tool! I have every financial transaction we have made going all the way back to 2008. If you are not using Mint I highly recommend you start today at mint.com
Once you have Mint setup, it is easy to assign transactions to predefined categories or create your own custom categories. I use the default categories for 95% of my transactions. Mint is also good at predicting where a transaction should go. If Mint gets it wrong, you can easily create rules to automatically assign transactions to categories based on the merchant and description. I find this works really well and I usually don’t need to touch many transactions manually. Assigning transactions to categories is also really helpful with budgeting but that is a topic for another day!
Step 2: Downloading your data from Mint
Once you have all the transactions assigned to categories you can easily download this data to complete your annual financial review. Mint provides some basic yearly summary reports but I have found them very limiting. What I really want to see is a multi-year view of all my categories along with income and savings over time. By downloading the data into an Excel file, I can create exactly the view I want. To download your transactions, log into Mint and go to the transactions page. On that page, scroll down to the bottom and you should see a small link “Export all transactions”: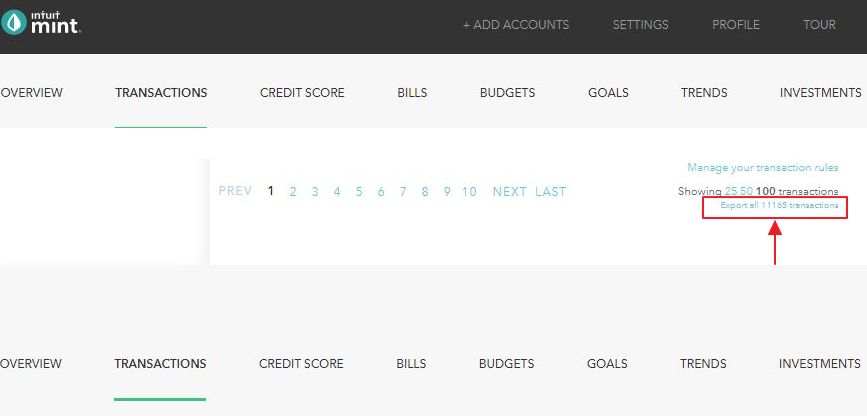
Wow, I currently have 11,165 transactions in Mint! When you click on the above link your browser will download a CSV data file with all the transactions since you started using Mint. The CSV file will contain all the important fields:
Date
Description
Original Description
Amount
Transaction Type
Category
Account Name
Labels
Notes
Step 3: Importing Mint data into the Excel document
Now that you have the data it is time to import into the Excel file. Download the excel template that I use here:
Example Annual Financial Summary v1
Note: The template file is populated with some sample data just to help show how it works. I have also shaded all the input fields in blue to separate them from the formula fields.
The excel template file contains 11 tabs:
- Summary KPI’s: The rolllup of all the KPI’s
- BalanceSheet: Record all your year end account balances
- Income: Record paycheck data and income
- Expenses: Detailed categorization of all expenses
- Taxes: Record all 1040 and income tax return data
- Investments: Categorization of all Investments
- HSA-Medical-Dental: Record all HSA transactions
- SSA-Earnings: Lifetime recording of social security income
- MintDataPivot: Pivot Chart view of all Mint transactions
- MintDataTransactions: All the Mint transactions
- MintCategoryHierarchy: Default and custom Mint categories
We will start with the MintDataTransactions tab that currently contains the sample data. Open the Mint CSV file that was downloaded, select all the data, copy and then paste the data into MintDataTransactions cell F1. Next you will want to copy the formula in Column A-E to the bottom of your data set. These columns add some additional attributes to the data that I find helpful. The check duplicates is included as Mint will sometimes have bank communication issues that results in duplicate transactions. This attribute identifies transactions with the same date, description, and amount as possible duplicates. If you do find any duplicates you can go into Mint, mark them as duplicates, and re-download.
TIP: If I find any errors or issues with the Mint data I always go back and make the edits in Mint. This keeps the source data clean and then I re-download to the excel file. Don’t edit the Mint transaction data in Excel!
Step 4: Reviewing the expense data
Once the Mint data is entered go to the MintDataPivot tab and refresh the data. You should now see all of the sample data replaced with your own data broken out by category and year. I like using the pivot data view for a quick overview and to help find any potential data errors. The pivot view is simple but is a little restrictive in terms of formatting so I like to use Excel SUMIFS formulas instead to get the data in exactly the view I want. To do this we will now move to the Expense tab.
The expense tab is driven my a formula template that looks like this from cell B3:
=SUMIFS(MintDataTransactions!$I:$I,MintDataTransactions!$A:$A,Expenses!B$2,MintDataTransactions!$K:$K,Expenses!$A3,MintDataTransactions!$J:$J,”debit”)-SUMIFS(MintDataTransactions!$I:$I,MintDataTransactions!$A:$A,Expenses!B$2,MintDataTransactions!$K:$K,Expenses!$A3,MintDataTransactions!$J:$J,”credit”)
In simple terms: sum the amounts from MintDataTransactions in Column I, with a match against the year in Expenses B2 and the category from Expenses A3. Add those values up for debits, do the same for credits, and take the difference between them. In addition, the formula uses relative references so it can easily be copied between cells as you adjust the format for how you want your categories listed.
Entering and Organizing Expense Categories
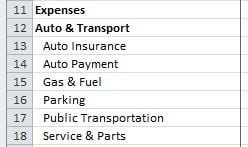
The template file is organized by the Mint default categories and I have also added a few custom categories that I use. You can completely customize this tab with additional categories/rows that you may have added to Mint. You can see what I am tracking by looking at the MintCategoryHierarchy tab. This tab allows for the sections and categories to be listed separately which I prefer. The key to the expenses tab, is making sure that you have all the categories that you use on Mint included for a complete picture. I also like using the default top level categories that Mint does and then putting sub categories under each main category like this
Once you have all the categories included and organized make sure the formula from B3 above is copied to all the rows that have categories and columns that have years. You can use Column A from MintDataPivot to see if you have not included any categories.
TIP: I exclude Income, Investments, and Transfer transactions from Mint in the expenses view as I like to have those on separate tabs.
Medical and Dental EXPENSES
I use an HSA so all my medical and dental expenses are run through a debit card linked to my HSA. Unfortunately these transactions can’t be linked to Mint so I manually download them to the HSA-Medical-Dental tab and then use this formula in cell B101 to bring the data in:
=SUMIFS(‘HSA-Medical-Dental’!$E:$E,’HSA-Medical-Dental’!$A:$A,Expenses!B$2,’HSA-Medical-Dental’!$G:$G,Expenses!$A101)
Reviewing Each Expense Line
Once I have all the data categorized on the expenses tab, I then go line by line and review our spending for the year. I look at the variance to last year, and what the trend looks like year over year. I will typically find a number of categorization issues during this step. For example, this year I saw that our electricity usage was much higher than last year and our gas bill was much lower. After looking at the mint data, I realized that half way through the year our gas provider changed their billing name. Mint got confused with this and started allocating the gas bill to electricity. These types of issues are all easily fixed in the transactions tab in Mint. After going through all the data and fixing any issues, I re-download the data and import to refresh the data.
The power of the expenses tab is the data! Being able to see exactly where your money is going and how it changes over time is the only way you can truly begin to optimize your spending and makign sure you are spending less than you make.
Step 5: Record account balances
After expenses, we now move to the BalanceSheet tab. On 12/31 each year I will screenshot my Mint summary screen and manually record all the account balances in the excel file. On this tab, you will enter all your assets, liabilities, and then be able to calculate your net worth. The sample file includes some common accounts but you will need to customize this for your particular situation. After entering all the data, double check your calculations against the net worth calculation in Mint to make sure everything is included.
Tracking your net worth over time is critical. It is the key to financial independence, and is the most important KPI to be tracking.
Step 6: Record your income information
Next, we will move to the Income tab but before we do there is a critical step: download and save a copy of the last paycheck of the year! The end of year paycheck is super helpful as it includes all your full year earnings information. I only started doing this 5 years ago and really wish I had started doing it when I first started working. You can piece together parts of your full year income from tax returns, but having the actual paycheck is a lot easier as it provides a better picture with all the deductions. The Income tab includes space for two paychecks but you can modify as needed. Line 62 on the Income tab adds up both paychecks to Total Net Pay.
Comparing Mint Income to your Paycheck
Once you have entered all your paycheck information, we now need to include other income sources like interest and dividends for a complete picture. Mint lets you categorize your income so we will leverage the Mint data again to help us with this. In cell B66 we use the same formula template that we used from the expenses tab:
=SUMIFS(MintDataTransactions!$I:$I,MintDataTransactions!$A:$A,B$1,MintDataTransactions!$K:$K,$A66,MintDataTransactions!$J:$J,”credit”)-SUMIFS(MintDataTransactions!$I:$I,MintDataTransactions!$A:$A,B$1,MintDataTransactions!$K:$K,$A66,MintDataTransactions!$J:$J,”debit”)
Here are the categories that I use for additional income but these can all be customized for how you would like to view the data:
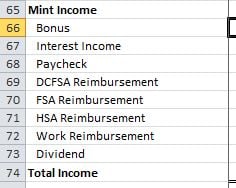 On line 63 I include a “Variance to Mint” line as a data check against the Paycheck/Bonus/Dividend categories in Mint as those are all recorded to Income.
Step 7: Record social security
The Social Security Administration has a great website for tracking all of your earnings and contributions. Each year I log into ssa.gov to make sure the information is accurate and I also download our annnual social security statements. Once I have downloaded the statement, I will record our lifetime earnings information on the SSA-Earnings tab. We will use this data later when talking about the KPI’s
Step 8: Review investment information
Next, we move to the investments tab. This is where we record what investments were made each year. The 401k amounts are pulled from the paycheck information on the Income tab. Next, we will manually enter the 401k match (if any) on lines 6 and 7. Finally, we have 4 lines for primary investment accounts.:
Roth IRA
IRA
529 Plan
Index Fund
I categorize these types of transaction in Mint using custom categories under “Finnacial”. Since these are recorded in mint, we can leverage the same data formula we have used above. In cell B8 for Roth IRA:
=SUMIFS(MintDataTransactions!$I:$I,MintDataTransactions!$A:$A,Investments!B$2,MintDataTransactions!$K:$K,Investments!$A8,MintDataTransactions!$J:$J,”debit”)-SUMIFS(MintDataTransactions!$I:$I,MintDataTransactions!$A:$A,Investments!B$2,MintDataTransactions!$K:$K,Investments!$A8,MintDataTransactions!$J:$J,”credit”)
Step 9: Taxes
Understanding how taxes influence your total financial picture is very important. You will not be able to fill this part out until after you get all your W2’s and file your taxes. I like to record all the W2 tax information in this file along with high level tax information like: Adjusted Gross Income, Federal/State Taxable Income, Total Federal/State Tax, and Effective Federal/State Tax Rate.
Step 10: Analyse and review KPI’s
If you have made it this far, congratulations! I know this can be a little intimidating to get setup the first time, but once you understand how everything works it usually only takes me a couple hours each year to update it. For each new year, I update by adding an extra column to all the tabs and then copy the formulas over.
KPI’s and savings Rate
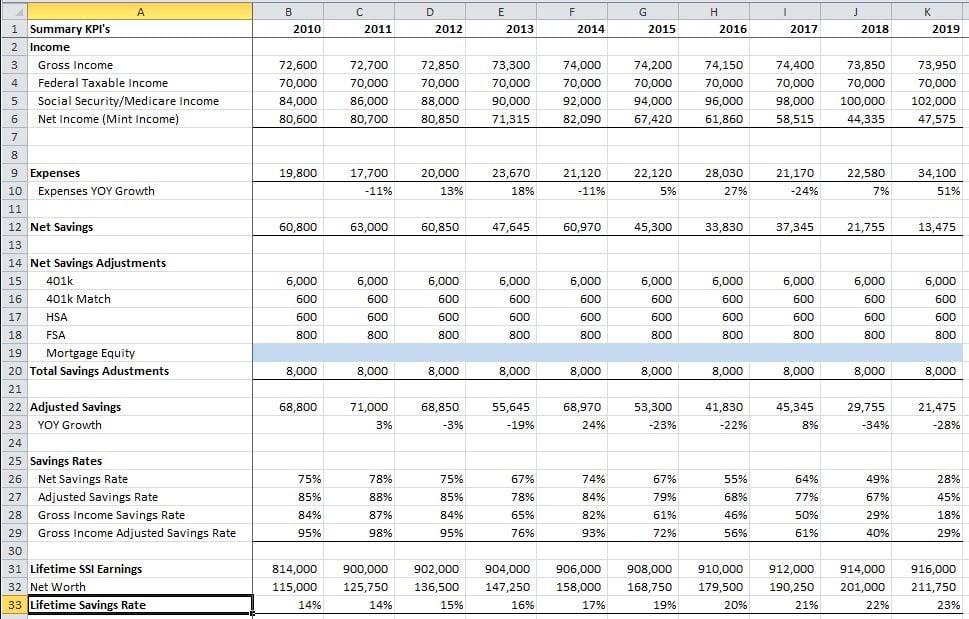
The final tab to review is the Summary KPI’s tab. This is where this whole document comes together. If you have got everything input and categorized correctly your entire financial picture should come into focus on this tab with very minimal effort. Let’s now walk through how this tab is setup. I start with pulling in the 4 income amounts I track:
- Gross Income: Total Earnings, Interest, and Dividends
- Federal Taxable Income: What you report on your 1040 (you won’t be able to get this until you file your taxes)
- Social Security/Medicare Income. Earnings as reported by SSA
- Net Income (Mint Income): Items recorded as Income in Mint
Then we pull in the total expenses from the expenses tab. Now we are able to start calculating savings and savings rate. You would think this would be pretty easy but there are a few things to consider that make it more complicated than: (income – expenses) / income.
Net SAvings
The easiest way to look at savings and savings rate is what I call Net Savings. On line 12, we take our Net Income (Mint Income) subtract our expenses to get Net Savings, and then divide by Net Income to get a Net Savings Rate on line 26. The is the most simple way to look at savings rate and the argument for this method is you can’t save what you don’t receive in your net paycheck. While this is true, I don’t think it tells the complete story as you could be “saving” via payroll deductions.
Adjusted Net Savings
To account for additional savings that are not counted in Net Savings, I create a series of savings adjustments that I add to savings to create adjusted net savings and the corresponding adjusted net savings rate. The adjustments I have included in the template are as follows:
- 401k
- 401k Match
- HSA
- FSA
- Mortgage Equity
401k, HSA, and FSA are all pretax payroll deductions so they are added back as a form of savings. I also include the 401k match as I think you should get credit for this as well! The final adjustment is Mortgage Equity. This can be a little controversial and there are arguments on both sides for if it should be included or not. I generally tend to agree that paying down your mortgage via the equity portion of your monthly payment is a method of forced savings so I include it here.
gross Savings
There is one flaw to the above adjusted savings rate that I want to point out. If you add back things like your pretax payroll deductions it can inflate your savings numbers as you are mixing pre and post tax dollars. This can become even more of a problem if you are taking advantage of deferred compensation plans as you can end up with a savings rate over 100% which does not make sense. To avoid this, you can also look at your savings as a percentage of your gross income. If you use the gross number, your overall savings rate is not going to be as high but I could argue that it is more accurate.
There is no perfect way to measure this so I have included both methods and encourage you to run the numbers and see what works for you. The key here is making sure the data is accurate and your are consistent in your methodology when looking at it year to year.
lifetime Gross savings rate
Life time savings rate is one of my favorite KPI’s to watch! In a single number, you can see exactly how much progress you are making towards your financial goals. The first step is we bring in your cumulative lifetime gross earnings on line 29, from the SSA Earnings tab. We then bring in your Net Worth from the balance sheet on line 30, and then we divide your net worth by your lifetime gross earnings to calculate your lifetime gross savings rate. See how powerful this number is? Of all the income you have earned in your life, how much have you been able to retain through savings and investments?
When I think about the lifetime gross savings rate, I break it down into 5 categories:
- <0%: You are living beyond your means and not saving anything
- 0-30%: You are starting to plan and save for your future. You might be early in your career at this point.
- 30-70%: You are making solid progress now and well on your way to financial independence!
- 70-100%: You are in rare company at this level and are likely already financially independent or will be soon.
- >100%: You are a financial rockstar. Your savings and investment growth have now eclipsed your entire lifetime earnings. Congratulations!
The final items that I include on the Summary KPI tab are the tax rates and overall net worth growth over time.
Step 11: Review everything with your spouse or significant other
Once this is all done, the last step is I will sit down with my wife Crystal and we will talk about all the data. We will discuss how we did, and the game plan for next year. This step is crucial to make sure we both remain on the same page. I am our household CFO, but she is the CEO! It is important that even though I handle all the finances, she knows exactly what is going on.
Do you do an annual financial review? What is your end of the year routine? If you do try out the template please leave a comment with any suggestions or improvements.
Download Template: Example Annual Financial Summary v1
